As a server administrator, it’s crucial to monitor server resources regularly to ensure that everything is running smoothly. In this article, we’ll cover some of the essential tools that you can use to monitor server resources.
Top
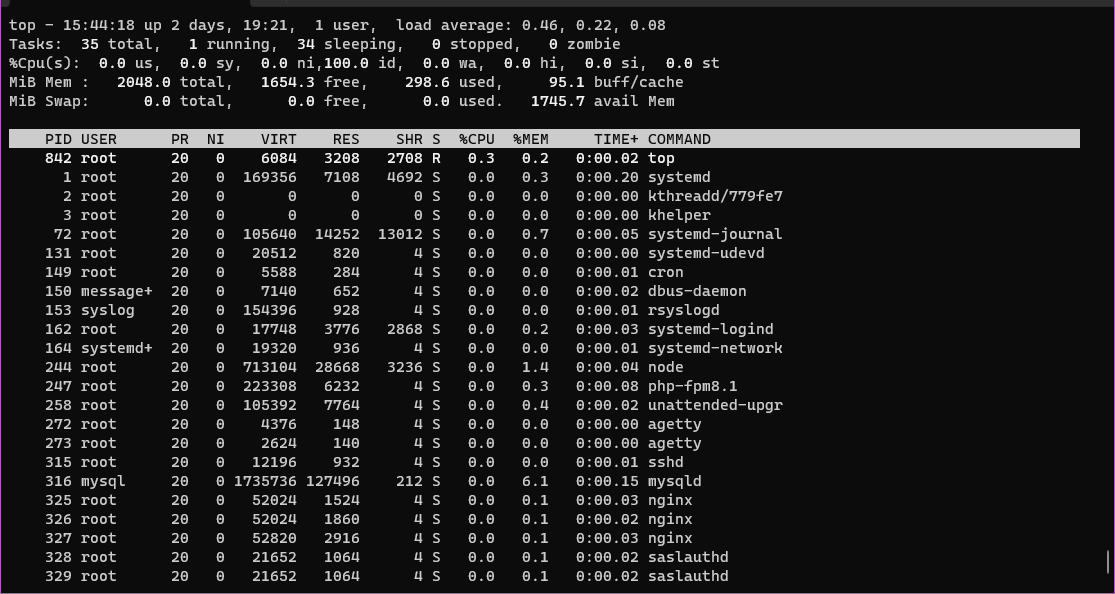
Top is a command-line tool that provides real-time information about the system’s processes, including CPU usage, memory usage, and system load. To use top, open your terminal and type:
$ topYou can use the following keys to interact with top:
q: Quittop.k: Kill a process.r: Renice a process.H: Toggle thread view.z: Toggle color/monochrome.
Netstat
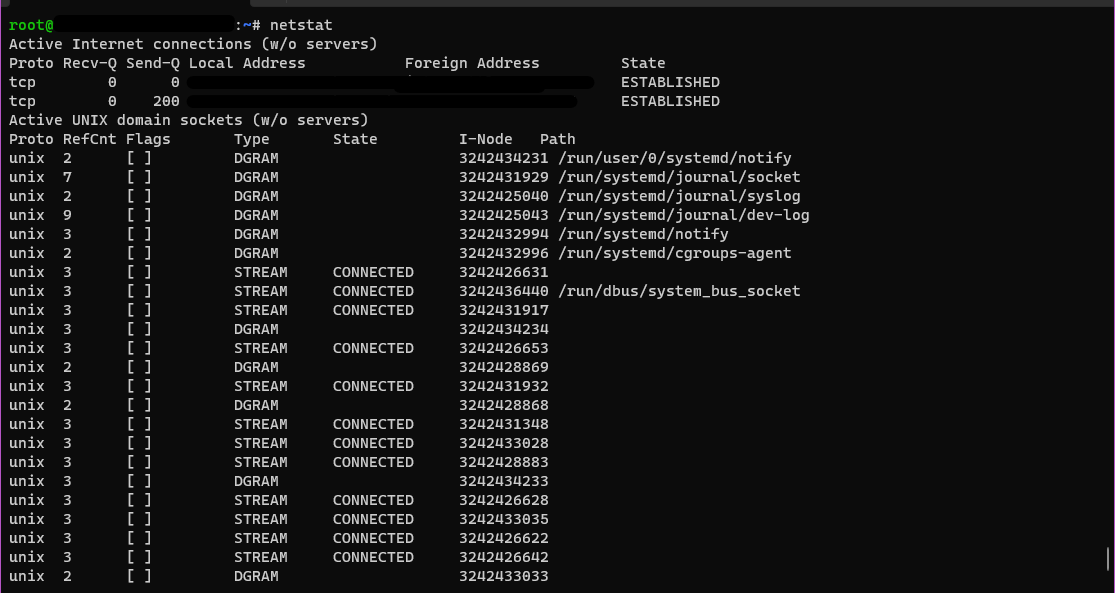
Netstat is a command-line tool that displays network connections, routing tables, and network interface statistics. To use netstat, open your terminal and type:
$ netstat -aThis command will show all the network connections that are active on your system.
You can use the following keys to interact with netstat:
a: Show all sockets.n: Don’t resolve names.p: Show the PID and name of the program to which each socket belongs.r: Show the routing tables.s: Show statistics.
Du
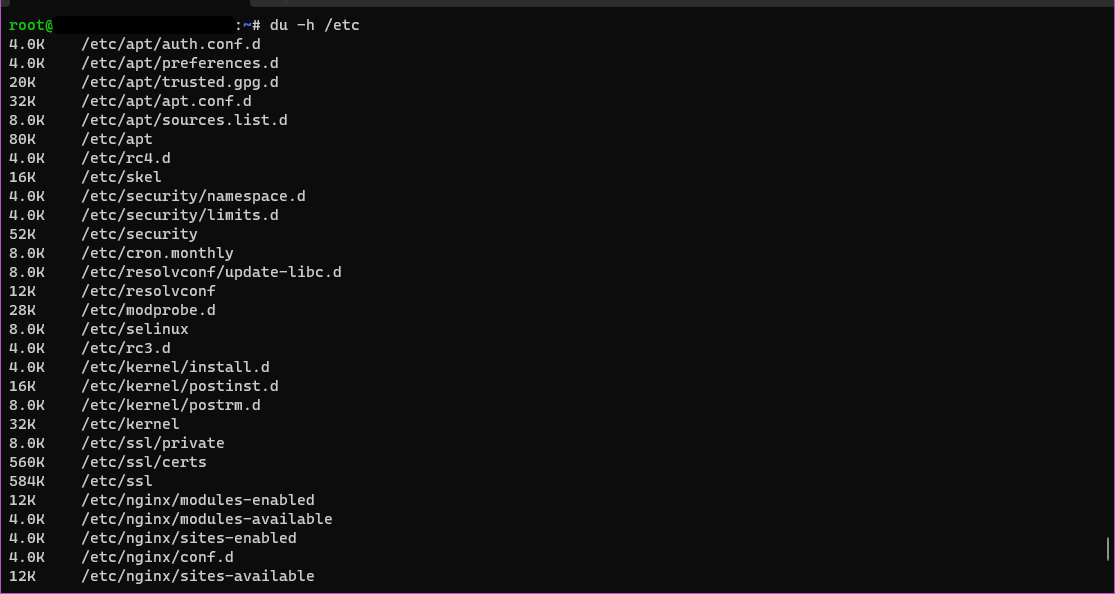
Du is a command-line tool that displays disk usage statistics for a file or directory. To use du, open your terminal and type:
$ du -h /path/to/directoryThis command will display the disk usage of the specified directory in a human-readable format.
You can use the following keys to interact with du:
-h: Display sizes in a human-readable format.-s: Display only a total for each argument.-c: Display a grand total for all arguments.
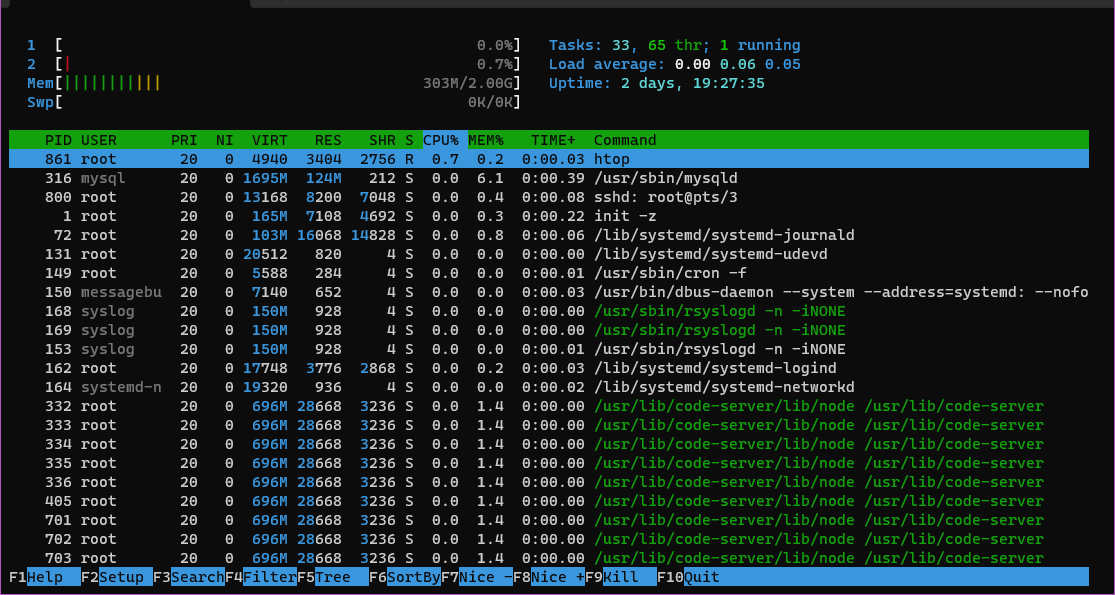
Htop
Htop is an interactive process viewer and system monitor that provides a more user-friendly interface than top. To use htop, open your terminal and type:
$ htopYou can use the following keys to interact with htop:
F1: Help.F2: Setup.F3: Search.F4: Filter.F5: Tree view.F6: Sort by.F7: Nice – increase process priority.F8: Nice – decrease process priority.F9: Kill process.F10: Quit.
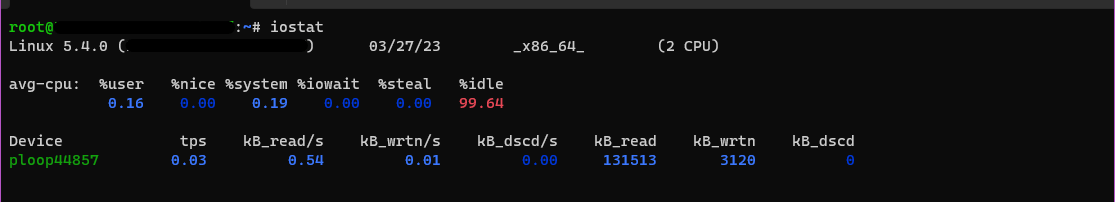
Iostat
Iostat is a command-line tool that displays CPU utilization and I/O statistics. To use iostat, open your terminal and type:
$ iostatYou can use the following keys to interact with iostat:
-c: Show only CPU utilization.-d: Show only disk I/O statistics.-k: Show output in kilobytes.-m: Show output in megabytes.
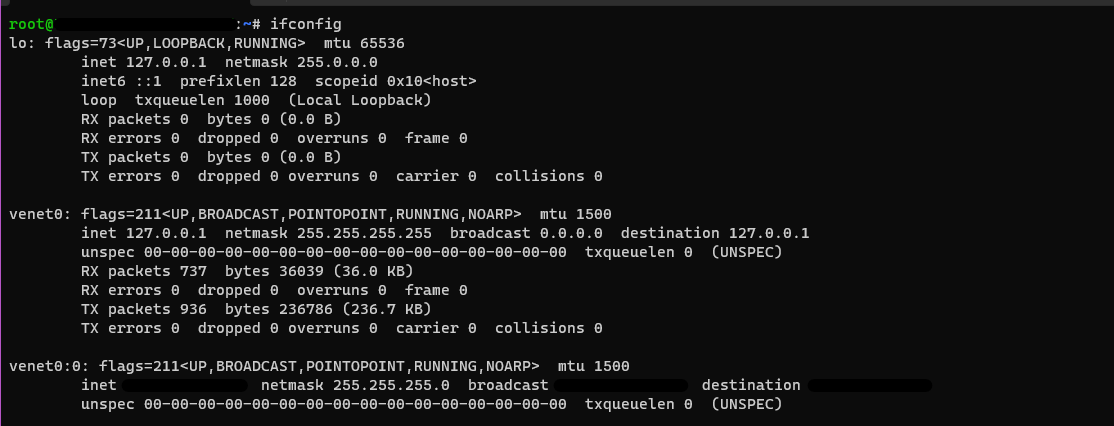
Net-tools
Net-tools is a collection of command-line tools that provides information about network connections and interfaces. To use net-tools, open your terminal and type:
$ ifconfigThis command will show information about all network interfaces on your system.
You can use the following keys to interact with net-tools:
ifconfig: Show information about network interfaces.route: Show routing table.arp: Show the ARP cache.
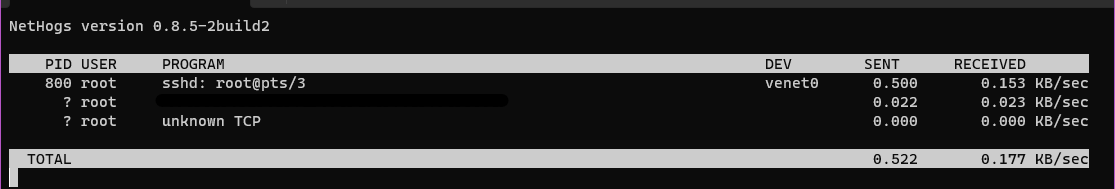
Nethogs
If your network connection seems overutilized and you are unsure which application is the culprit, a program called nethogs is a good choice for finding out.
Nethogs is a command-line tool that provides real-time network bandwidth monitoring.
On Ubuntu, you can install nethogs with the following command:
$ sudo apt install nethogsTo use nethogs, open your terminal and type:
$ sudo nethogsThis command will show the network bandwidth usage of each process on your system.
You can use the following keys to interact with nethogs:
q: Quitnethogs.s: sort by SENT trafficr: sort by RECEIVE trafficm: switch between total (KB, B, MB) and KB/s mode
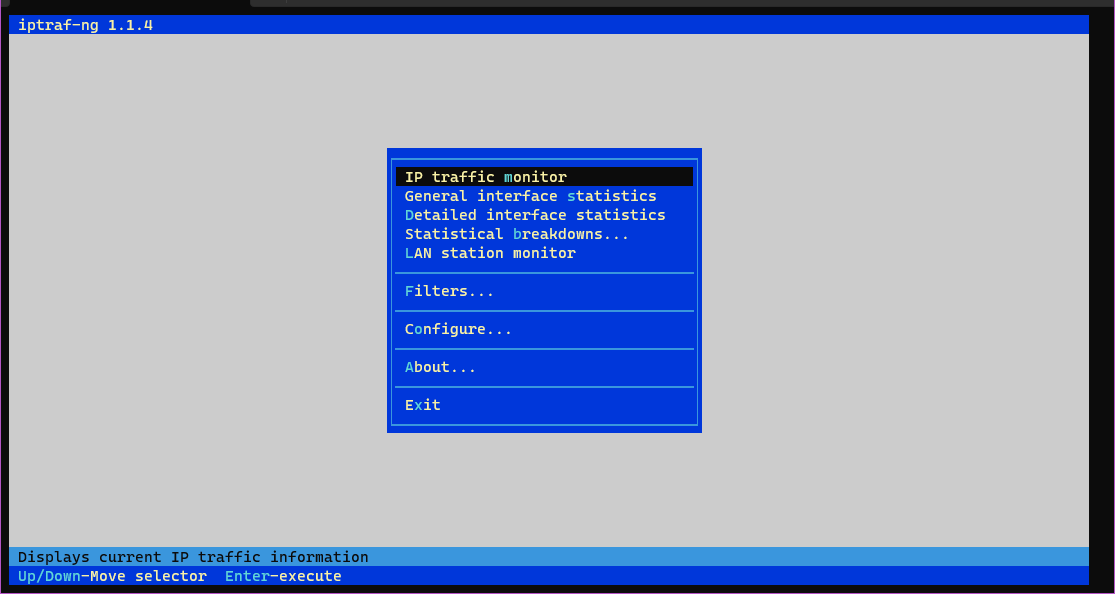
Iptraf-ng
Iptraf-ng is a command-line tool that provides real-time network statistics for each network interface on your system.
you can install iptraf-ng with the following command:
$ sudo apt install iptraf-ngTo use iptraf-ng, open your terminal and type:
$ sudo iptraf-ngThis command will show real-time statistics for each network interface.
You can use the following keys to interact with iptraf-ng:
q: Quitiptraf-ng.s: Display statistics for selected interface.n: Display statistics for next interface.r: Refresh display.d: Display detailed statistics.u: Display UDP statistics.t: Display TCP statistics.
Conclusion
These are just a few of the many tools available to monitor server resources. By regularly monitoring server resources, you can ensure that your server is running smoothly and efficiently.